How to Connect Airtable to a Dashboard
Need to turn Airtable data into a dashboard? We’ll use a Campaigns table as the example. Each record has a campaign name, date, channel, spend, and leads. The team wants to see which channels bring in leads and how much each one costs.
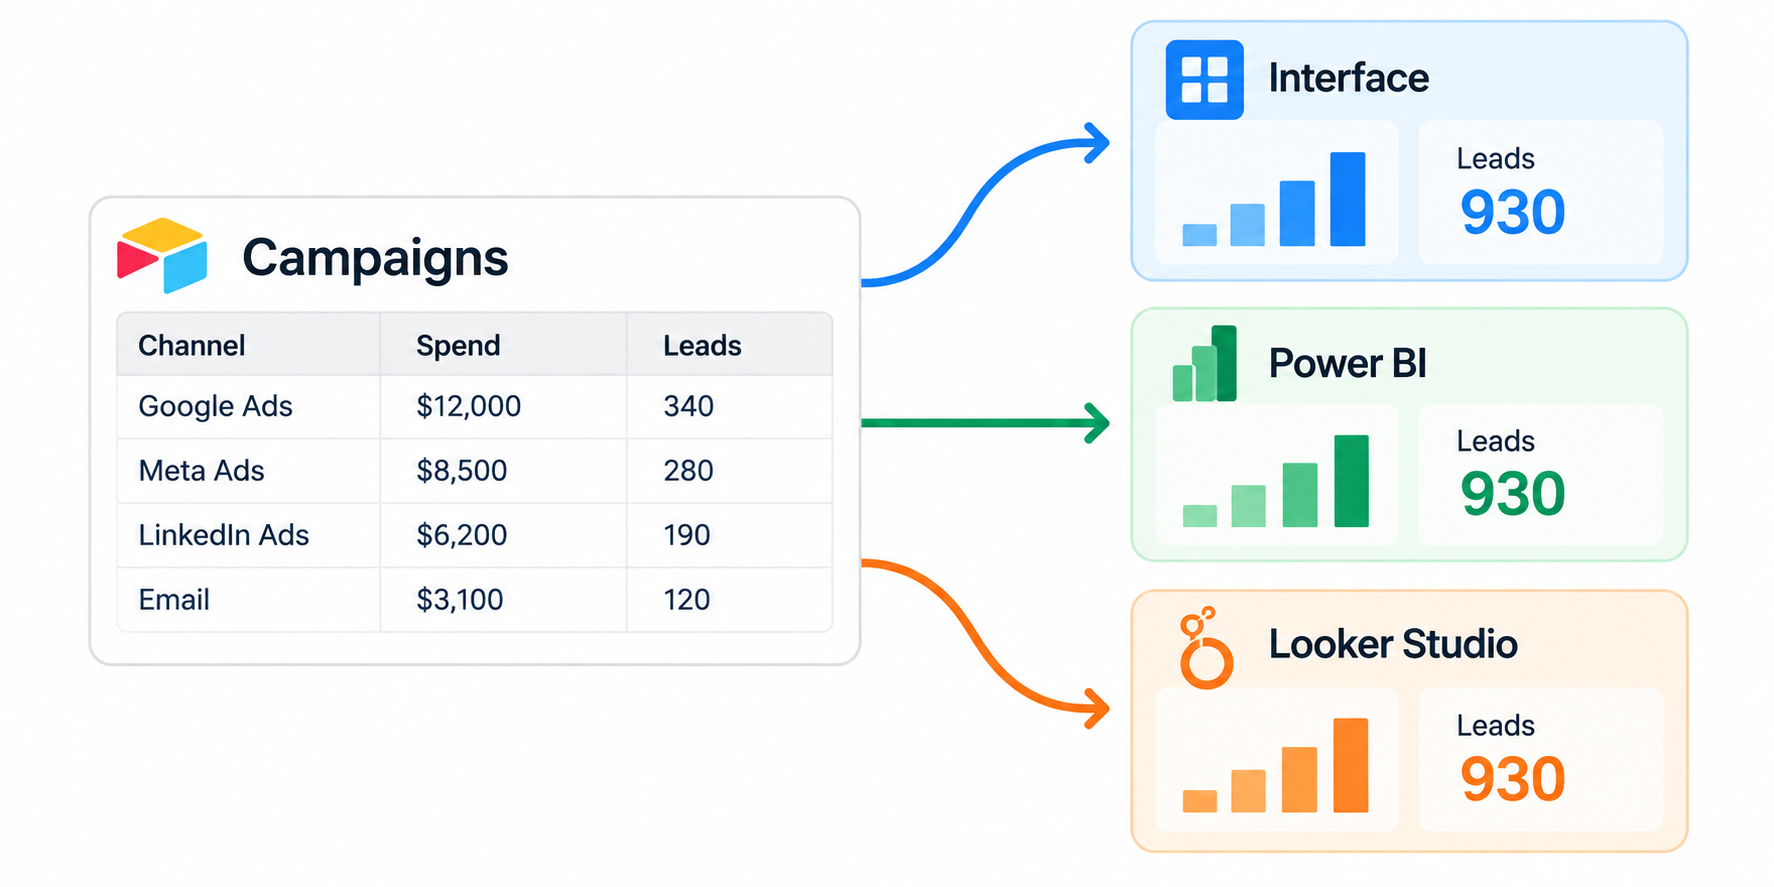
Before connecting anything, create a Campaigns view with the fields the report needs: campaign name, date, channel, spend, and leads. Fill in those values for each campaign so the dashboard can read complete data.
Use an Airtable Interface for an Airtable dashboard
An Interface is the simplest option when the Campaigns table is already your source of truth. You can build a dashboard page with charts, numbers, lists, and filters without sending the data somewhere else.
Open the base, select Interfaces, and create a page with the Dashboard layout. Add a chart for leads by channel, a number element for total spend, and a filter for the campaign date. Share the Interface with the people who need the report.
This keeps the dashboard connected to the same records your team updates, and users can click a number or chart to open the related Airtable records. For more examples of Airtable charts and the difference between chart elements and the Chart extension, see how to create charts and graphs in Airtable.
If you need to send the dashboard by email, see how to email an Airtable dashboard or Interface.
Connect Airtable to Power BI
Power BI is a better fit when the Campaigns table is only one part of the report. For example, the dashboard may combine Airtable campaign data with advertising costs, website analytics, or sales data already stored in another system.
To bring the Campaigns table into Power BI, use Power BI Desktop and Power Query with an Airtable personal access token that can read the base. Once the data loads, build the charts and report in Power BI.
The connection reads Airtable data for the report. It does not send edits from Power BI back to Airtable. For the current setup, see Airtable’s Power BI and Power Query instructions.
Connect Airtable to Looker Studio
Looker Studio is useful when your team already builds reports in Google's reporting tools. Airtable does not list a native Looker Studio connector in its current integration options, so you need a connector or another data source between Airtable and the report.
For a straightforward setup, use a connector such as Coupler.io. Connect Airtable as the source, choose the Campaigns table or view, and select Looker Studio as the destination. The connector then refreshes the data on its schedule.
You can also send Airtable data to Google Sheets first and use that sheet as the Looker Studio source. This adds another step, but it gives you a place to clean up column names or calculate fields before the dashboard reads them.
Choose the connector based on how often the dashboard needs fresh data, how many records it will read, and whether the report combines other sources. A dashboard that updates once a day needs a simpler setup than one that people use to monitor live operations.
If the dashboard needs data from more than one Airtable base, sync the source tables into a reporting base first. Then build the Interface or external report from that reporting base. See how to display data from two Airtable bases in one Interface for that setup.