How to Display Data from Two Airtable Bases in One Interface
Airtable Interfaces are powered by a single base. When you create an Interface, every element on every page pulls data from tables within that one base. There is no native way to connect an Interface page directly to two separate bases at the same time.
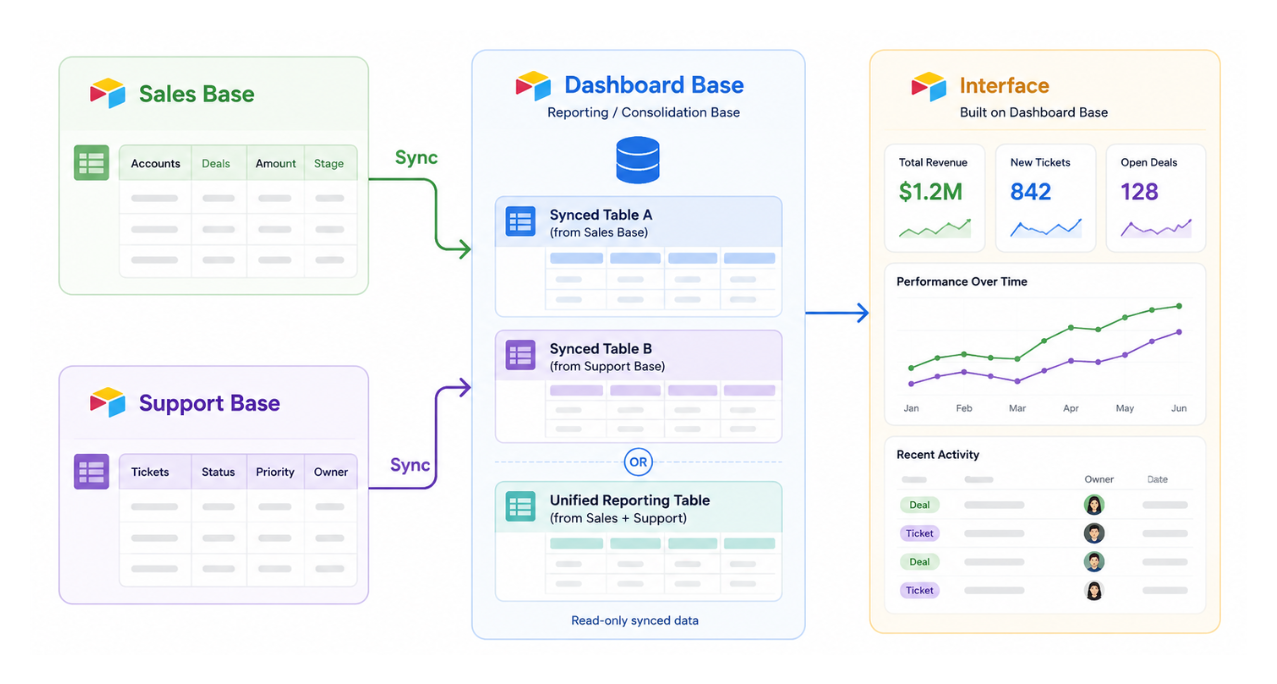
The workaround is to create a dedicated dashboard base that receives synced data from both of your source bases. Your Interface is built on this dashboard base, and it has access to all the data because both sources have been synced into it.
Step 1: Create a New Dashboard Base
Create a new base in your workspace. Name it something clear like "Dashboard" or "Reporting Base." This base exists purely to consolidate data from your two source bases. It will not hold any original data of its own.
Step 2: Choose Your Sync Approach
You have two options for how to sync the source data in, and the right one depends on your data structure.
Option A: Sync Each Source Into a Separate Table
If the two bases have different structures or you want to keep the data clearly separated, sync each source base into its own table inside the dashboard base.
In the dashboard base, click the plus icon to add a new table and choose "Sync from another base." Select the first source base and the specific table and view you want to sync. Repeat the process to add a second synced table from your second source base.
Your dashboard base now has two tables, one from each source.
When building the Interface on the dashboard base, you can place elements from each table on separate pages, or on the same page using separate groups. Each group on a dashboard page can pull from a different table.
The limitation with this approach: you cannot combine data from two separate tables into a single chart or a single list view. If you want one unified chart covering both sources, use Option B.
Option B: Sync Both Sources Into the Same Table
If the two bases share a similar structure (same or similar fields), use Airtable's multi-source sync to sync both into a single table in the dashboard base.
When setting up the sync table, add the first source, then click to add a second sync source to the same table. Map the fields from both sources to the same columns in the destination table.
With both sources feeding into one table, your Interface can display a single chart, a single list, or a single report that covers data from both original bases. This is the cleaner option for unified reporting.
Step 3: Build the Interface on the Dashboard Base
Once your sync is set up, open the dashboard base and create your Interface from there. Add pages, charts, grids, and summary elements that pull from the synced tables.
Because this Interface lives in the dashboard base, it has access to all the data from both original sources.
What to Know About Synced Tables
Synced tables in the dashboard base are read-only. You cannot edit records directly in the dashboard base. All edits must happen in the original source bases, and the sync will carry those changes over to the dashboard base on its next sync cycle.
Sync frequency depends on your plan. On the Team plan, syncs run every 5 minutes. On Business and Enterprise plans, sync can be set to run more frequently or triggered manually.
If you need the dashboard to update instantly rather than on a delay, trigger a manual sync by clicking the sync indicator on the synced table. Note that syncs can pause when a base has had no recent activity. If your dashboard is going stale overnight or over weekends, keeping the sync active with a scheduled automation prevents this.